


Protein ConformationThe fact that proteins with a single tryptophan generally exhibit multi-exponential decay is well known. To what degree the components from a multi-exponential fit actually represent distinct structures the protein can adapt is still an open question. In a collaborative project with the University of Minnesota - Duluth, we have generated data over a range of temperatures for the C2A domain of the protein synaptotagmin. The fluorescence lifetime of this molecule is one of the highest known, approaching 10 ns. The protein is also very resistant to aggregation upon melting.
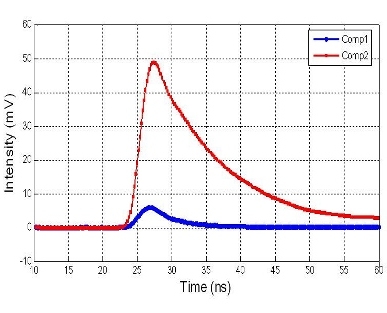
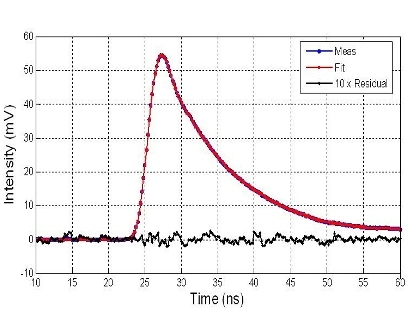
Figure 1 shows a two-component analysis of the fluorescence decay curve at 20 C. Fluorescence Innovations tunable UV source was used to excite at 295 nm. The acquisition time per waveform was four seconds and the data were collected at magic angle. The long component accounts for approximately 93% of the total fluorescence intensity. Figure 2 illustrates the outstanding quality of the two-component fit. The residuals indicate less than a 0.2% difference between the observed and fitted decay curves at peak intensity.
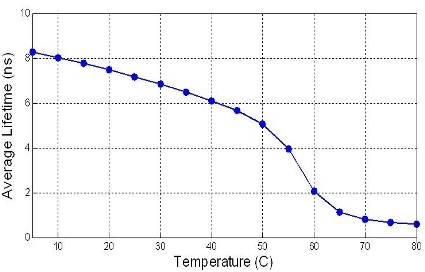
The fluorescence decay of synaptotagmin C2A was measured at 5-degree intervals from 5 C to 90 C. The lifetime shows a sharp decrease at around 60 C as the protein melts, i.e., goes from a folded to a denatured form. The mole fraction averaged lifetime as a function of temperature is shown in Figure 3. Up to 50 C, the lifetime of the long component drops linearly with temperature, whereas the short component lifetime changes very little. The mole fractions (amplitudes in the fit) of the two components are nearly unchanged in the 5 to 50 C range. As the melting begins, the mole fraction of the long component drops relative to the mole fraction of the shorter component and additional components are needed to get a good fit. Fully understanding the molecular implications of these phenomena is a significant research endeavor, but it is clear the speed and precision of the Fluorescence Innovations's UV lifetime technology makes these kinds of experiments easy to conduct.
Using the NovaFluor PR Fluorescence Lifetime Plate Reader to automate the process described here, one can measure protein conformation on as many as five samples per second using microgram quantities of each protein. Contact us to learn more. |